The ultimate guide on financial statement analysis. In today’s data-driven world, the ability to dissect and understand a company’s financial health is no longer a skill reserved for Wall Street analysts. Whether you’re an investor looking for the next big opportunity, a business owner striving for sustainable growth, or a student aspiring to a career in finance, mastering financial statement analysis is your key to making informed, intelligent, and profitable decisions.
This comprehensive blog post will walk you through everything you need to know about financial statement analysis, from the fundamental concepts to advanced techniques. We’ll explore how to read and interpret financial statements, the various methods of analysis, and how to use this knowledge to your advantage. So, grab a cup of coffee, and let’s dive into the fascinating world of numbers that tell a story.
What is Financial Statement Analysis?
At its core, financial statement analysis is the process of reviewing a company’s financial statements to make better economic decisions. These statements, which include the income statement, balance sheet, and cash flow statement, provide a snapshot of a company’s financial health and performance over a specific period. By analyzing these documents, you can gain valuable insights into a company’s profitability, liquidity, solvency, and efficiency.
Think of financial statement analysis as being a detective. You’re given a set of clues (the financial statements), and your job is to piece them together to understand the full story of a company’s financial situation. Is the company a thriving enterprise with a bright future, or is it struggling to stay afloat? Financial statement analysis helps you answer these critical questions.
The Three Pillars of Financial Statements
Before we delve into the analysis techniques, it’s crucial to understand the three primary financial statements that form the basis of our investigation.
1. The Income Statement: The Profitability Puzzle
The income statement, also known as the profit and loss (P&L) statement, shows a company’s financial performance over a specific period, such as a quarter or a year. It summarizes the company’s revenues, expenses, and profits. The bottom line of the income statement, net income, tells you whether the company made a profit or a loss during that period.
2. The Balance Sheet: A Snapshot in Time
The balance sheet provides a snapshot of a company’s financial position at a single point in time. It’s based on the fundamental accounting equation: Assets = Liabilities + Equity. The balance sheet gives you a clear picture of what a company owns (assets), what it owes (liabilities), and the owners’ stake (equity).
3. The Cash Flow Statement: The Flow of Money
The cash flow statement (CFS) measures the cash generated and used by a company during a specific period. It’s a crucial statement because it shows how a company is managing its cash position, which is vital for its survival and growth. The CFS is divided into three sections: cash flow from operating activities, investing activities, and financing activities.
Why is Financial Statement Analysis So Important?
Now that we have a basic understanding of what financial statement analysis is, let’s explore why it’s such a critical skill. The importance of financial statement analysis extends to a wide range of stakeholders, each with their own unique interests.
For Investors: Making Smart Investment Decisions
For investors, financial statement analysis is the cornerstone of a sound investment strategy. By analyzing a company’s financial statements, investors can:
- Assess the company’s profitability: Is the company generating enough profit to provide a good return on investment?
- Evaluate its financial health: Does the company have a strong balance sheet and enough cash flow to weather economic downturns?
- Identify potential red flags: Are there any warning signs in the financial statements that could indicate future problems?
- Compare different investment opportunities: Financial statement analysis allows investors to compare the financial performance of different companies in the same industry and make an informed choice.
For Business Owners and Managers: Driving Strategic Growth
For those at the helm of a company, financial statement analysis is an indispensable tool for strategic planning and decision-making. It enables them to:
- Monitor performance: Track key performance indicators (KPIs) and identify areas of the business that are performing well and those that need improvement.
- Make informed decisions: Whether it’s a decision to expand into a new market, launch a new product, or invest in new technology, financial statement analysis provides the data-driven insights needed to make the right choices.
- Secure financing: When seeking a loan from a bank or other financial institution, a thorough financial statement analysis can demonstrate the company’s creditworthiness and increase the chances of securing financing.
- Benchmark against competitors: By analyzing the financial statements of competitors, business owners can identify industry trends and benchmark their own performance.
For Creditors: Assessing Creditworthiness
Creditors, such as banks and suppliers, use financial statement analysis to assess the creditworthiness of a company before extending credit. They want to know if the company has the ability to repay its debts on time. A strong financial position, as revealed by the analysis, can lead to more favorable credit terms.
Financial Statement Analysis: Methods and Techniques
Now, let’s get into the practical side of things. How do you actually perform a financial statement analysis? There are several methods and techniques that you can use, and the most effective approach often involves a combination of them.
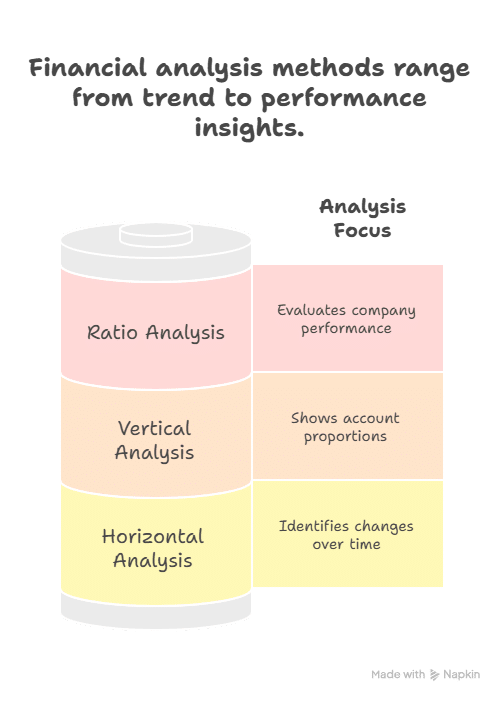
1. Horizontal Analysis: Tracking Trends Over Time
Horizontal analysis, also known as trend analysis, involves comparing a company’s financial data over a series of reporting periods. This allows you to identify trends and patterns in the company’s performance. For example, you could compare a company’s revenue and net income over the past five years to see if it’s growing, stagnating, or declining.
To perform a horizontal analysis, you typically choose a base year and then express the figures for subsequent years as a percentage of the base year. This makes it easy to see the percentage change in each line item over time.
2. Vertical Analysis: Seeing the Big Picture
Vertical analysis, also known as common-size analysis, involves expressing each line item on a financial statement as a percentage of a base figure within that statement. For the income statement, the base figure is usually total revenue, while for the balance sheet, it’s total assets.
Vertical analysis allows you to see the relative size of each line item and how it contributes to the overall picture. For example, by expressing each expense on the income statement as a percentage of revenue, you can see which expenses are having the biggest impact on the company’s profitability.
3. Ratio Analysis: The Power of Comparison
Ratio analysis is one of the most powerful and widely used techniques in financial statement analysis. It involves calculating various financial ratios to gain insights into different aspects of a company’s performance. These ratios can be categorized into several groups:
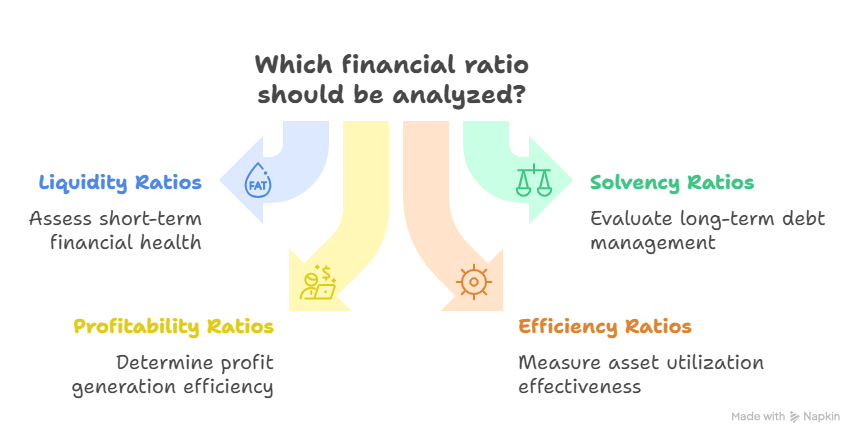
A. Liquidity Ratios: Can the Company Pay its Short-Term Bills?
Liquidity ratios measure a company’s ability to meet its short-term obligations. Some of the most common liquidity ratios include:
- Current Ratio: Current Assets / Current Liabilities
- Quick Ratio (or Acid-Test Ratio): (Current Assets – Inventory) / Current Liabilities
B. Solvency Ratios: A Look at Long-Term Viability
Solvency ratios measure a company’s ability to meet its long-term obligations. They provide insights into a company’s financial leverage and its ability to stay in business over the long run. Key solvency ratios include:
- Debt-to-Assets Ratio: Total Debt / Total Assets
- Debt-to-Equity Ratio: Total Debt / Total Equity
- Interest Coverage Ratio: EBIT / Interest Expense
C. Profitability Ratios: How Well is the Company Generating Profits?
Profitability ratios measure a company’s ability to generate profits from its sales, assets, and equity. They are some of the most closely watched ratios by investors. Important profitability ratios include:
- Gross Profit Margin: (Revenue – Cost of Goods Sold) / Revenue
- Net Profit Margin: Net Income / Revenue
- Return on Assets (ROA): Net Income / Total Assets
- Return on Equity (ROE): Net Income / Total Equity
D. Efficiency Ratios: Making the Most of Assets
Efficiency ratios, also known as activity ratios, measure how efficiently a company is using its assets to generate sales. They provide insights into a company’s operational efficiency. Common efficiency ratios include:
- Asset Turnover Ratio: Revenue / Total Assets
- Inventory Turnover Ratio: Cost of Goods Sold / Average Inventory
- Receivables Turnover Ratio: Revenue / Average Accounts Receivable
A Step-by-Step Guide to Performing a Financial Statement Analysis
Now that you’re familiar with the key concepts and techniques, let’s walk through a step-by-step guide to performing a financial statement analysis.
Step 1: Gather the Financial Statements
The first step is to gather the company’s financial statements for the period you want to analyze. For publicly traded companies, these documents are readily available on their investor relations websites or through the Securities and Exchange Commission (SEC) EDGAR database.
Step 2: Perform a High-Level Review
Before diving into the detailed analysis, it’s a good idea to perform a high-level review of the financial statements to get a general sense of the company’s financial health. Look for any significant changes or trends that stand out.
Step 3: Conduct Horizontal and Vertical Analysis
Next, perform a horizontal and vertical analysis of the income statement and balance sheet. This will help you identify trends and see how the company’s financial position has changed over time.
Step 4: Calculate and Analyze Financial Ratios
Calculate a range of financial ratios to gain deeper insights into the company’s liquidity, solvency, profitability, and efficiency. Compare these ratios to industry benchmarks and the company’s own historical performance to get a better context.
Step 5: Analyze the Cash Flow Statement
Don’t forget to analyze the cash flow statement. This will give you a clear picture of how the company is generating and using cash. Pay close attention to the cash flow from operating activities, as this is a key indicator of a company’s ability to generate cash from its core business operations.
Step 6: Look Beyond the Numbers
While the numbers in the financial statements are important, they don’t tell the whole story. It’s also crucial to consider qualitative factors that can impact a company’s financial performance, such as:
- The company’s business model and competitive landscape
- The quality of its management team
- The overall economic environment
- Any potential risks or opportunities that the company faces
Step 7: Synthesize Your Findings and Draw Conclusions
The final step is to synthesize all of your findings and draw your own conclusions about the company’s financial health and future prospects. This is where your analytical skills and judgment come into play.
The Limitations of Financial Statement Analysis
While financial statement analysis is a powerful tool, it’s important to be aware of its limitations.
- Historical Data: Financial statements are based on historical data, which may not be indicative of future performance.
- Inflation: Inflation can distort the figures in financial statements, making it difficult to compare data over time.
- Accounting Policies: Different companies may use different accounting policies, which can make it difficult to compare their financial statements.
- Window Dressing: Companies may sometimes use accounting tricks to “window dress” their financial statements and make their performance look better than it actually is.
The Future of Financial Statement Analysis: The Role of AI and Big Data
The field of financial statement analysis is constantly evolving, and the rise of artificial intelligence (AI) and big data is set to revolutionize the way we analyze financial information. AI-powered tools can analyze vast amounts of data in a fraction of the time it would take a human analyst, and they can identify patterns and insights that might be missed by the human eye.
However, this doesn’t mean that human analysts will become obsolete. The future of financial statement analysis will likely involve a combination of human expertise and AI-powered tools, with AI handling the heavy lifting of data analysis and human analysts providing the critical thinking and judgment needed to interpret the results and make informed decisions.
Conclusion
Congratulations! You’ve just completed a deep dive into the world of financial statement analysis. We’ve covered a lot of ground, from the basics of financial statements to the advanced techniques used by professional analysts.
Remember, mastering financial statement analysis is a journey, not a destination. It takes time and practice to develop the skills and confidence needed to analyze financial statements effectively. But by applying the concepts and techniques we’ve discussed in this guide, you’ll be well on your way to making more informed, intelligent, and profitable financial decisions.
So, what are you waiting for? Start practicing your new skills today. Pick a company you’re interested in, download its financial statements, and start your own analysis. You might be surprised by what you discover.
FAQs
What is financial statement analysis?
Financial statement analysis is the process of examining a company’s financial statements to make better economic decisions. The three main financial statements are the income statement, the balance sheet, and the statement of cash flows. By analyzing these, you can assess a company’s performance and financial health.
Why is financial statement analysis important?
It’s crucial for various stakeholders for several reasons:
1. Investors use it to assess the financial health of a company and decide whether to invest.
2. Creditors use it to determine a company’s ability to repay loans.
3. Management uses it to identify strengths and weaknesses and to make informed business decisions.
What are the main components of financial statements?
The three core financial statements are:
1. Income Statement: Shows a company’s revenues, expenses, and profit or loss over a period of time.
2. Balance Sheet: Provides a snapshot of a company’s assets, liabilities, and equity at a specific point in time. The fundamental accounting equation it’s based on is Assets = Liabilities + Equity.
3. Statement of Cash Flows: Reports the cash generated and used by a company during a period, categorized into operating, investing, and financing activities.
What are the common methods of financial statement analysis?
The primary methods used are:
1. Horizontal Analysis: Compares financial information over a series of reporting periods to identify trends.
2. Vertical Analysis: Shows the relative sizes of different accounts on a financial statement. Each line item is expressed as a percentage of a base figure (e.g., total assets on the balance sheet or total sales on the income statement).
3. Ratio Analysis: Involves calculating various financial ratios to gain insights into a company’s performance in areas like liquidity, profitability, and solvency.
What are financial ratios?
Financial ratios are calculations that relate two or more financial statement items. They are used to evaluate various aspects of a company’s operating and financial performance. They are often categorized as:
1. Liquidity Ratios: Measure a company’s ability to meet its short-term obligations. (e.g., Current Ratio)
2. Solvency Ratios: Gauge a company’s ability to meet its long-term debt obligations. (e.g., Debt-to-Equity Ratio)
3. Profitability Ratios: Indicate how well a company is generating profits from its operations. (e.g., Net Profit Margin)
4. Efficiency Ratios: Measure how effectively a company is using its assets. (e.g., Asset Turnover Ratio)
What are the limitations of financial statement analysis?
While powerful, financial statement analysis has limitations:
1. Based on Historical Data: It reflects past performance and is not a guarantee of future results.
2. Inflation: Financial statements do not always account for the impact of inflation.
3, Different Accounting Methods: Companies may use different accounting practices, making direct comparisons difficult.
4. Doesn’t Tell the Whole Story: It focuses on quantitative data and may not capture qualitative factors like management quality or brand reputation.