Mastering capital budgeting and investment decisions can make or break a company. In the late 1990s, two companies dominated the video rental market: Blockbuster and a small, quirky startup called Netflix. Blockbuster, sitting on a mountain of cash, had a major capital budgeting decision to make. Should it invest heavily in its massive network of physical stores, or should it pivot to an unknown, unproven mail-order DVD model?
It chose the stores.
Netflix, with a fraction of the resources, bet its entire existence on the opposite. It poured its limited capital into logistics and, later, a radical new idea called “streaming.”
We all know how this story ends. Blockbuster’s decision—a capital budgeting decision—led it to bankruptcy. Netflix’s decision made it a global media titan.
This is the power and peril of capital budgeting. It’s not just finance-speak; it’s the strategic framework for deciding where a company invests its most significant resources for long-term growth. These are the “bet-the-company” choices, the billion-dollar questions, and getting them right is the single most important driver of a company’s future value.
Defining Capital Budgeting
So, what is capital budgeting?
At its simplest, capital budgeting is the process a business uses to evaluate and select potential major projects or investments.
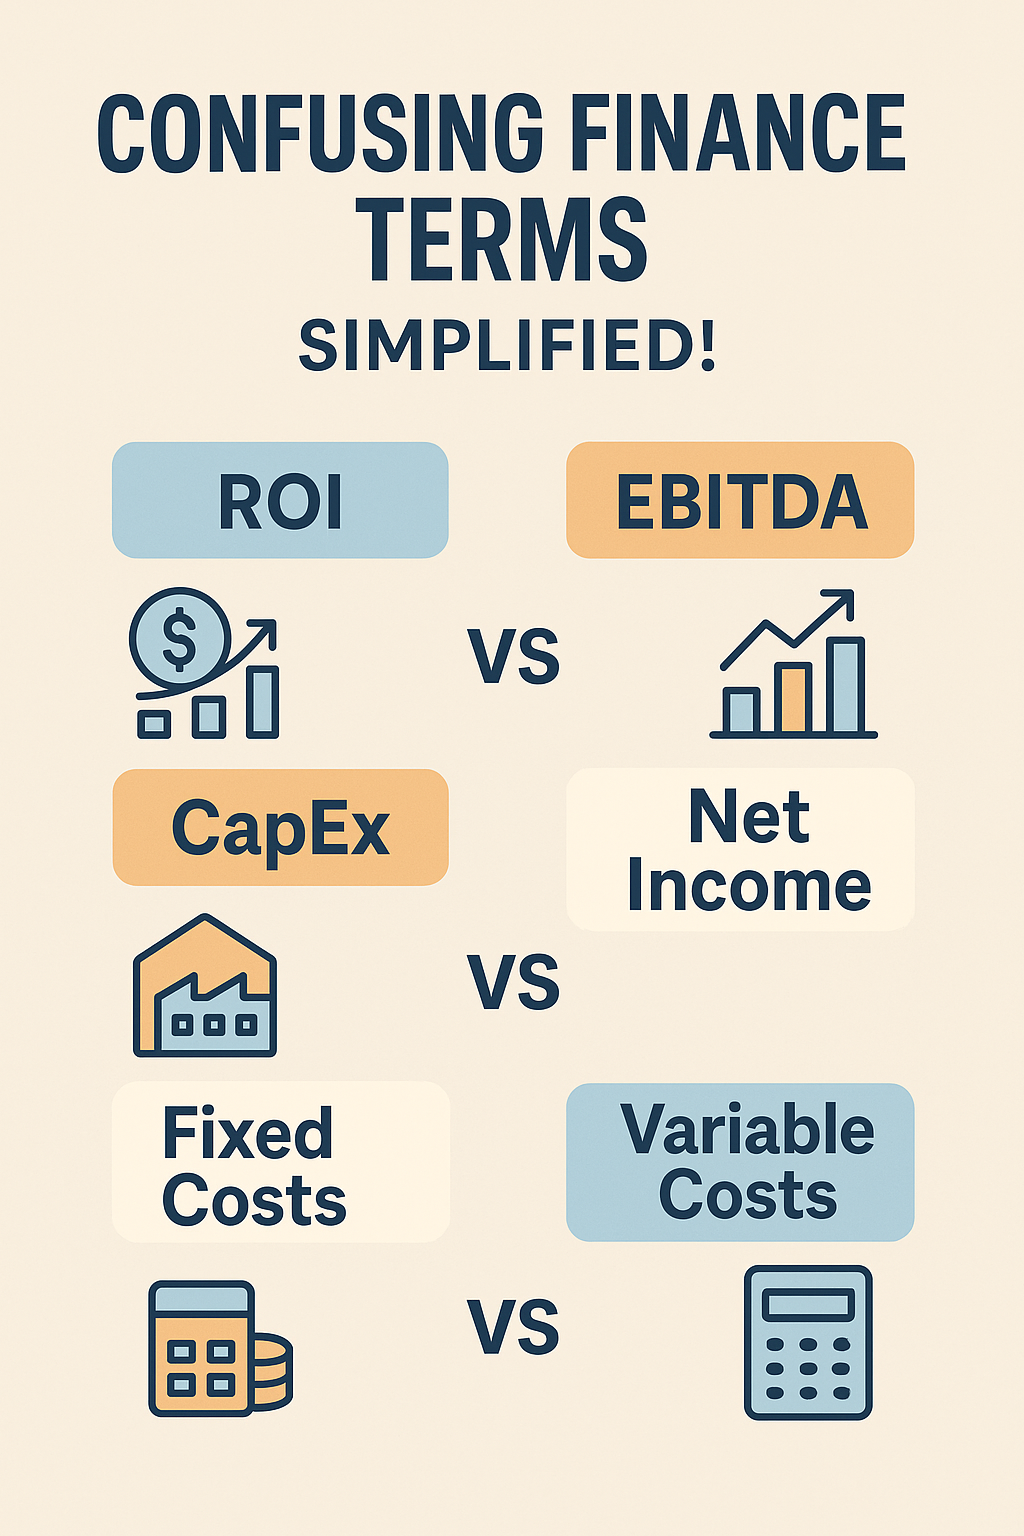
These aren’t everyday purchases like office supplies. We’re talking about large, long-term investments, also known as Capital Expenditures (CapEx). These are assets that will provide value for many years, such as:
- Building a new factory or production plant.
- Purchasing a fleet of delivery trucks.
- Acquiring another company.
- Investing millions in a new software system.
- Launching a new product line after extensive research and development.
The core challenge is that these projects require a massive cash outlay today in exchange for a stream of uncertain cash flows in the future. Capital budgeting gives us the tools to decide if that future stream is worth the upfront cost.
Defining Investment Decisions
If capital budgeting is the process, then investment decisions are the outcomes. An investment decision is the final choice to say “Yes, we will fund this project” or “No, we will pass.”
These decisions are directly linked to capital budgeting. The entire process—from idea generation to number-crunching—is designed to ensure that when the time comes to make that final decision, it’s based on rigorous data and strategic alignment, not just a gut feeling.
This guide focuses on long-term investment decisions (CapEx), as opposed to short-term decisions like managing inventory or daily cash (which falls under working capital management).
What This Guide Will Cover (And Why It Matters to You)
You don’t need to be a CFO to understand capital budgeting. In fact, you shouldn’t be. Whether you’re a finance student, an MBA candidate, a small business owner deciding on a new pizza oven, or a corporate manager pitching a new project, these concepts are vital.
This guide will walk you, step-by-step, from the basic “why” to the advanced “how.” We will cover:
- Why It Matters: The five core reasons capital budgeting is the key to business success.
- The 6-Step Process: A clear framework for evaluating any project.
- The Toolkit: A deep dive into the evaluation techniques (Payback, NPV, IRR, and PI), with clear examples.
- Risk & Uncertainty: How to handle the fact that all forecasts are wrong.
- Pitfalls & Best Practices: The common mistakes that sink projects and how to avoid them.
By the end of this 5,000-word guide, you won’t just know the definitions; you’ll have a complete framework for making smarter, more profitable, and more confident long-term investment decisions.
The Critical Importance: Why Master Capital Budgeting?
If a company’s day-to-day operations are its engine, then capital budgeting is its steering wheel. It determines the direction and, ultimately, the destination. Mastering this process is non-negotiable for five critical reasons.
1. Maximizing Shareholder Wealth: The Primary Goal
Let’s be clear: the primary financial goal of any for-profit company is to increase its value for its owners (the shareholders).
Capital budgeting is the single most powerful tool to achieve this. It’s not about just making a profit; it’s about creating value. It does this by providing a simple rule: only accept projects that are worth more than they cost.
As we’ll see, techniques like Net Present Value (NPV) tell you the exact dollar amount a project is expected to add to your company’s value. By consistently selecting value-creating projects, you are directly fulfilling the firm’s number one objective.
2. Strategic Alignment: Linking Projects to Long-Term Goals
Great ideas are not always good ideas for your company. Capital budgeting decisions are not made in a vacuum. They must be directly tied to the company’s overall strategy.
If your company’s 5-year strategy is to be the industry leader in sustainability, a capital budgeting proposal to invest in green technology and solar-powered facilities makes perfect strategic sense. A different proposal to acquire a cheap, high-polluting factory—even if it looks profitable on paper—would be a strategic mismatch.
The capital budgeting process forces managers to ask: “Does this project move us closer to our long-term goals?” It acts as a filter, ensuring that the company’s money, time, and energy are all pushing in the same direction.
3. Resource Allocation: Doing More with Less
No company on Earth has unlimited resources. Money, time, and skilled employees are all finite. This creates the problem of capital rationing.
You may be faced with ten good projects, all of which promise a solid return. But you may only have the budget to fund three of them. How do you choose?
This is where capital budgeting shines. It provides the analytical tools (like the Profitability Index) to rank these competing projects. It helps you find the combination of projects that generates the highest possible return for your limited budget. It’s the process of choosing the best projects, not just the good ones.
4. Risk Management: Avoiding Catastrophic Failures
A bad long-term investment can do more than just lose money; it can cripple or even bankrupt a company. Remember Blockbuster? That was a single, catastrophic investment decision.
The capital budgeting process is, at its heart, a risk management framework. It forces you to quantify and analyze the risks before a single dollar is spent.
- What happens if our sales forecasts are too optimistic?
- How will rising interest rates affect our costs?
- What if a new competitor enters the market?
By analyzing these risks upfront (using techniques we’ll cover later, like sensitivity and scenario analysis), you can avoid devastating failures and make decisions with a clear understanding of the potential downsides.
5. The Peril of Irreversible Decisions
If you buy the wrong brand of printer paper, it’s a small, easily corrected mistake. If you build a $500 million, custom-built factory in the wrong location, you can’t just return it.
Capital budgeting deals with decisions that are often largely irreversible. You can’t easily sell a half-built factory or a highly specialized piece of machinery for what you paid for it. Because the stakes are so high and the decisions so permanent, the analysis must be rigorous. A robust capital budgeting process is the company’s best defense against “buyer’s remorse” on a massive,-multi-million-dollar scale.
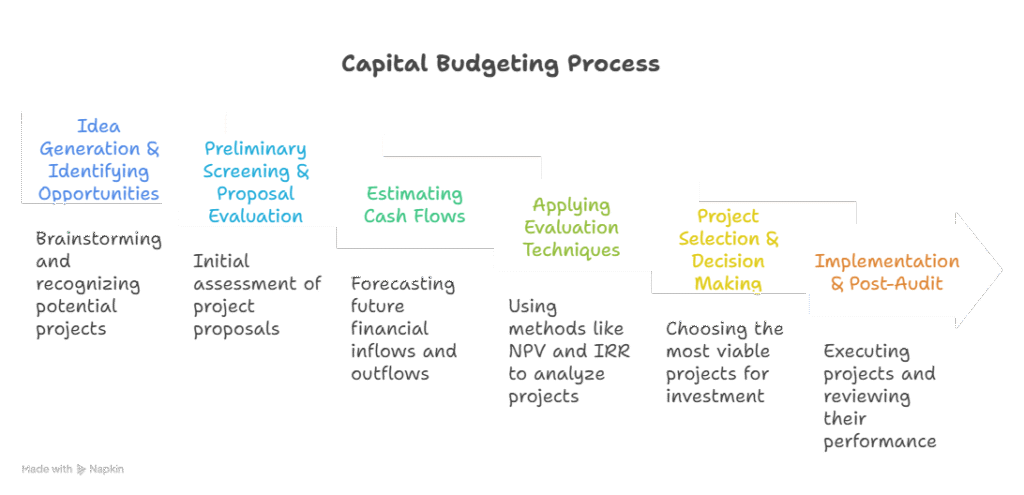
The 6-Step Capital Budgeting Process: A Step-by-Step Framework
Now that we understand why capital budgeting is so critical, let’s walk through the “how.” A good investment decision isn’t a single “aha!” moment; it’s a structured process. While the exact terminology might change, most successful companies follow this six-step framework.
Step 1: Idea Generation & Identifying Opportunities
Projects don’t appear out of thin air. The first step is to identify potential opportunities. Ideas can (and should) come from everywhere:
- Top-Down: Management decides to enter a new market or achieve a strategic goal (e.g., “We need to reduce our carbon footprint by 30%”).
- Bottom-Up: An engineer on the factory floor suggests a new machine that would improve efficiency.
- Market-Driven: The sales team identifies a new feature customers are demanding.
- Maintenance: An old, critical piece of machinery is nearing the end of its life and must be replaced.
At this stage, the goal is to cast a wide net and gather proposals.
Step 2: Preliminary Screening & Proposal Evaluation
Not all ideas are created equal. You can’t run a full-blown financial analysis on 100 different suggestions. This step is a quick filter to weed out projects that are clearly not a good fit.
The key question here is strategic alignment. A manager might ask:
- “Does this project align with our 5-year strategic plan?”
- “Do we realistically have the technical expertise to pull this off?”
- “Is the general scale of the investment ($10 million) way outside our budget ($1 million)?”
This isn’t a deep analysis, but a common-sense check to filter out the noise and focus resources on the most promising proposals.
Step 3: Estimating Cash Flows (The Most Critical Step)
This is the heart of capital budgeting and the single most important part of the entire process. It’s also the most difficult to get right.
Why? Because the inputs for all our fancy formulas (NPV, IRR) are only as good as our cash flow estimates. A bad estimate leads to a bad decision, no matter how good your math is.
A key rule: We focus on incremental cash flows, not accounting profit. We want to know how much more or less cash the company will have if and only if it takes on the project. We typically break this down into three parts:
1. Initial Investment Outlay
This is all the cash that leaves the company at “Year 0” (the start) to get the project running. It includes:
- The purchase price of the new asset (e.g., the machine).
- Any installation and shipping costs.
- Increases in Net Working Capital (NWC). This is a crucial and often-missed item. A new factory, for example, also requires an investment in inventory (raw materials) and might increase accounts receivable. This is cash tied up in the project.
2. Operating Cash Flows (OCF)
This is the net cash generated by the project each year of its life. The most common way to calculate this is:
OCF = (Sales – Costs – Depreciation) $\times$ (1 – Tax Rate) + Depreciation
Let’s break that down:
- (Sales – Costs – Depreciation): This is your operating profit before tax.
- $\times$ (1 – Tax Rate): This gives you your profit after tax (also called NOPAT, or Net Operating Profit After Tax).
- + Depreciation: We add depreciation back because it was a non-cash expense. We took it out for tax purposes, but we never actually mailed a check for “depreciation.” We add it back to get to the true cash flow.
3. Terminal Cash Flow (TCF)
This is the one-time cash flow at the end of the project’s life. It has two main components:
- After-Tax Salvage Value: The cash you get from selling the old asset. You must calculate the (Proceeds from Sale – Book Value) and pay taxes on any gain.
- Recovery of Net Working Capital: That NWC we tied up in Step 1 (like the inventory)? At the end of the project, we assume we can sell it off and recover that cash.
Step 4: Applying Evaluation Techniques
Once you have your estimated cash flows for each year (a negative number in Year 0, and a series of positive OCFs, plus a final TCF), it’s time to do the math.
This is where we apply the core techniques of capital budgeting—Payback Period, Net Present Value (NPV), and Internal Rate of Return (IRR). We will cover each of these in detail in the next section. Each tool analyzes those cash flows in a different way to help you judge the project’s financial merit.
Step 5: Project Selection & Decision Making
This is the “go/no-go” decision. Often, it’s not as simple as just picking the project with the highest NPV. The decision-making team must combine the quantitative data from Step 4 with qualitative factors.
- Quantitative: “Project A has an NPV of $1.2 million. Project B has an NPV of $900,000.”
- Qualitative: “Project A is a ‘me-too’ product in a highly competitive market. Project B, while less profitable, opens up an entirely new market for us and enhances our brand reputation.”
The final decision may be to choose Project B, even with a lower NPV, because it’s a better strategic fit. The numbers guide the decision, but human judgment makes the final call.
Step 6: Implementation & Post-Audit (Review)
The process isn’t over when the project is approved.
- Implementation: This is the project management phase—actually building the factory, installing the software, and launching the product.
- Post-Audit: This is the step most companies skip, and it’s a huge mistake. A year or two after launch, the finance team should go back and compare the actual cash flows to the projected cash flows from Step 3.
This isn’t about blaming people if the forecast was wrong. It’s about learning. Why were we wrong? Were our sales forecasts too optimistic? Did we underestimate costs? A post-audit is the feedback loop that makes a company better and better at capital budgeting over time.
The Core Techniques: Your Capital Budgeting Toolkit
Welcome to the “math” part. You’ve done the hard work of estimating your cash flows (Step 3). Now, it’s time to analyze them. These techniques are the tools you’ll use to evaluate those numbers and make a final, data-driven decision. We’ll start with the simplest and build up to the “gold standard.”
H3: The “Simple” (But Flawed) Method: Payback Period
H4: What is the Payback Period?
This is the most basic question: “How long will it take to get my initial money back?”
The Payback Period is the length of time, in years, required for a project’s cumulative cash inflows to equal its initial investment. It’s a measure of liquidity, not profitability.
How to Calculate It (with a Simple Example)
Let’s say you’re considering a project with the following cash flows:
- Initial Investment (Year 0): -$10,000
- Year 1 Cash Flow: +$3,000
- Year 2 Cash Flow: +$4,000
- Year 3 Cash Flow: +$3,000
- Year 4 Cash Flow: +$5,000
Let’s track the cumulative cash flow:
- End of Year 1: You’ve recovered $3,000. (Still need $7,000)
- End of Year 2: You’ve recovered $3,000 + $4,000 = $7,000. (Still need $3,000)
- End of Year 3: You’ve recovered $7,000 + $3,000 = $10,000.
The Payback Period is exactly 3 years.
If your company has a rule like “We only accept projects with a payback of 3 years or less,” this project would be accepted.
H4: Pros and Cons
- Pros: It’s simple, intuitive, and easy to calculate. It’s a good “back-of-the-napkin” check and is useful for companies that are tight on cash (high liquidity risk).
- Cons (These are MAJOR):
- It ignores the time value of money. It treats $3,000 in Year 3 as being worth the same as $3,000 in Year 1. We know this isn’t true.
- It ignores all cash flows after the payback period. In our example, it completely ignores the $5,000 profit in Year 4. What if a “better” project had a payback of 3.5 years but paid out $100,000 in Year 4? Payback would choose the “worse” project.
H3: An Improvement: Discounted Payback Period
H4: How This Fixes One of the Payback Period’s Biggest Problems
This method is a simple tweak that answers the question: “How long does it take to get my money back in today’s dollars?”
It’s the same as the Payback Period, but it uses discounted cash flows. It fixes the time value of money problem.
Let’s use our same example, but with a 10% discount rate:
- Initial Investment (Year 0): -$10,000
- Year 1: $3,000 / (1.10)^1 = $2,727
- Year 2: $4,000 / (1.10)^2 = $3,306
- Year 3: $3,000 / (1.10)^3 = $2,254
- Year 4: $5,000 / (1.10)^4 = $3,415
Now let’s track the cumulative discounted cash flow:
- End of Year 1: You’ve recovered $2,727. (Still need $7,273)
- End of Year 2: You’ve recovered $2,727 + $3,306 = $6,033. (Still need $3,967)
- End of Year 3: You’ve recovered $6,033 + $2,254 = $8,287. (Still need $1,713)
- End of Year 4: You’ve recovered $8,287 + $3,415 = $11,702.
It takes longer than 3 years. We recover the final $1,713 part-way through Year 4.
(Calculation: $1,713 needed / $3,415 received in Year 4 = 0.50 years)
The Discounted Payback Period is 3.5 years.
This is a much more accurate picture of the project’s risk. However, it still suffers from the second major flaw: it ignores all cash flows after the payback period.
The Gold Standard: Net Present Value (NPV)
This is it. If you only learn one technique, this is the one. Net Present Value (NPV) is the single best measure of a project’s profitability.
The Core Concept: The Time Value of Money (TVM)
The foundation of all modern finance is that a dollar today is worth more than a dollar tomorrow.
Why?
- Opportunity Cost: You could invest that dollar today and earn a return (e.g., in a savings account or the stock market).
- Inflation: In a year, that dollar will buy less than it does today.
Therefore, we must “discount” future cash flows to find their value in today’s terms, which is called their Present Value (PV).
The NPV Formula Explained (Simply)
The NPV formula looks scary, but the concept is simple.
NPV = [The sum of the Present Value of all future cash flows] – [The Initial Investment]
It adds up all the money the project will bring in (in today’s dollars) and then subtracts all the money you have to spend to get it started.
The “discount rate” (also called the “hurdle rate” or “Weighted Average Cost of Capital – WACC”) is the minimum return your company must earn on its investments. It’s your cost of money.
The Decision Rule (The Easiest Part)
This is what makes NPV so powerful. It gives you a single, unambiguous answer.
- If NPV is Positive (NPV > $0): ACCEPT. The project is expected to earn more than your minimum required return. It creates value for the company.
- If NPV is Negative (NPV < $0): REJECT. The project is expected to earn less than your minimum required return. It destroys value.
- If NPV is Zero (NPV = $0): Indifferent. The project is expected to earn exactly your minimum required return. You’re not richer or poorer.
Worked Example of an NPV Calculation
Let’s use our same project from before, with the 10% discount rate.
- Initial Investment: -$10,000
- PV of Year 1 CF: $2,727
- PV of Year 2 CF: $3,306
- PV of Year 3 CF: $2,254
- PV of Year 4 CF: $3,415
NPV = ($2,727 + $3,306 + $2,254 + $3,415) – $10,000
NPV = $11,702 – $10,000
NPV = +$1,702
Decision: ACCEPT. This project is expected to add $1,702 of value to the company in today’s dollars.
The “Break-Even” Metric: Internal Rate of Return (IRR)
IRR is the second-most popular method, mainly because managers love to talk in percentages.
What is the IRR?
The Internal Rate of Return (IRR) is the specific discount rate that makes the project’s NPV equal to exactly zero.
Think of it this way:
- NPV asks, “If my cost of money is 10%, how much value do I create?” (Answer: $1,702)
- IRR asks, “What is this project’s intrinsic percentage return, regardless of my cost?” (Answer: X%)
It’s the “break-even” rate for the project. In our example, the IRR would be the rate that makes the PV of the future cash flows exactly equal the $10,000 investment. (Using a financial calculator, the IRR for this project is 15.67%.)
The Decision Rule
You compare the IRR to your company’s “hurdle rate” (your minimum required return, e.g., 10%).
- If IRR > Hurdle Rate: ACCEPT. (e.g., 15.67% > 10%) The project’s intrinsic return is higher than your cost of money.
- If IRR < Hurdle Rate: REJECT. (e.g., if our hurdle rate was 20%, we’d reject it).
The Pitfalls of IRR: When It Can Lie
IRR is useful, but it has two serious flaws:
- Mutually Exclusive Projects: If you have to choose between two projects (e.g., “Project A” or “Project B”) that can’t both be done, IRR can give you the wrong ranking. Project A might have a higher IRR (e.g., 25%) but a lower NPV (e.g., +$1 million). Project B might have a lower IRR (e.g., 20%) but a higher NPV (e.g., +$2 million). You must always choose the project with the higher NPV. Maximizing dollar value (NPV) is the goal, not maximizing percentage rate (IRR).
- Unconventional Cash Flows: If a project has weird cash flows (e.g., -100, +200, -50), it can have multiple IRRs or no IRR at all, making the metric useless.
NPV vs. IRR: Which is Better and When?
The winner is NPV. It is always the most reliable and theoretically correct method.
- NPV is superior because it measures the total dollar value added to the firm, which is the ultimate goal.
- IRR is still popular because it’s an intuitive percentage that’s easy to communicate (“This project has a 16% return”).
Best Practice: Calculate both. If a project has a positive NPV and an IRR above your hurdle rate, you can be very confident. If they conflict, always trust the NPV.
The Ranking Tool: Profitability Index (PI)
How to Calculate PI
The Profitability Index (PI) is a simple ratio, also known as the “benefit-cost ratio.”
PI = (Present Value of Future Cash Flows) / (Initial Investment)
From our example:
PI = $11,702 / $10,000 = 1.17
The decision rule is simple: Accept any project with a PI greater than 1.0. (A PI of 1.17 just means that for every $1.00 invested, you get $1.17 back in today’s dollars).
When to Use PI: The Capital Rationing Problem
So why use this if we have NPV? PI’s one, very important job is to help with capital rationing.
Imagine you have a budget of $20,000 and three positive-NPV projects:
- Project A: Costs $20,000. NPV = +$5,000. PI = 1.25
- Project B: Costs $12,000. NPV = +$4,000. PI = 1.33
- Project C: Costs $8,000. NPV = +$3,000. PI = 1.37
If you just follow NPV, you’d take Project A (the highest NPV) and your budget is gone. Total NPV = $5,000.
If you rank by PI (the most “bang for your buck”):
- Take Project C (PI = 1.37). You spend $8,000.
- Take Project B (PI = 1.33). You spend $12,000.
Your total budget of $20,000 is spent. Your total NPV = $4,000 (from B) + $3,000 (from C) = +$7,000.
By using PI to rank the projects, you created $2,000 more value for the company.
Beyond the Basics: Incorporating Risk and Uncertainty
If you’ve followed along this far, you have a powerful set of tools. You can take a list of cash flow projections and calculate, with precision, an NPV, IRR, and Payback Period.
But there’s a huge, uncomfortable truth we need to talk about.
Why Your Cash Flow Forecasts Are Always Wrong
Every single number we used in Step 3—our sales projections, cost estimates, and salvage values—is a forecast. It’s an educated guess about an unknown future.
No one has a crystal ball. Your sales forecast for Year 5 will be wrong. Your cost of raw materials will fluctuate. A new competitor might enter the market.
The goal of risk analysis is not to perfectly predict the future. The goal is to understand the impact of being wrong. A good capital budgeting decision isn’t just one that looks good on a spreadsheet; it’s one that holds up, or at least doesn’t fail catastrophically, when reality hits.
Here are the most common techniques to stress-test your projections.
Technique 1: Sensitivity Analysis
This is the “what-if” analysis. Sensitivity analysis changes one variable at a time to see how it affects the project’s NPV.
It helps you answer questions like:
- “What happens to our NPV if our sales are 10% lower than we expected?”
- “What happens to our NPV if our raw material costs are 20% higher?”
- “What happens to our NPV if the project life is only 4 years instead of 5?”
By doing this, you can quickly identify the most critical variables. You might find that a 10% drop in sales turns the NPV negative, while a 10% rise in costs barely makes a dent. This tells you that your sales forecast is the most sensitive variable, and you should spend the most time making sure it’s as accurate as possible.
Technique 2: Scenario Analysis
Scenario analysis is a more advanced version of sensitivity analysis. Instead of changing just one variable, you change all the key variables at once to create a few distinct “stories” about the future.
Typically, you build three separate models:
- Best-Case Scenario: High sales, low costs, high salvage value, etc. This is the “everything goes perfectly” model.
- Base-Case Scenario: This is your original, most-likely forecast.
- Worst-Case Scenario: Low sales, high costs, a new competitor enters the market, etc. This is the “everything goes wrong” model.
You then calculate the NPV for all three scenarios. This gives you a range of possible outcomes instead of a single number. For example:
- Worst Case: NPV = -$1.2 Million
- Base Case: NPV = +$1.7 Million
- Best Case: NPV = +$4.5 Million
This is far more useful than just the base-case number. It tells management that while the project is likely profitable, there is a realistic scenario where it could lose a significant amount of money. The decision is now more nuanced: “Are we comfortable with the risk of losing $1.2 million for the potential to make $1.7 million or more?”
Technique 3: Risk-Adjusted Discount Rate (RADR)
This technique approaches risk from a different angle. Instead of adjusting the cash flows (like in scenario analysis), you adjust the discount rate.
The concept is simple: Riskier projects should be held to a higher standard.
- A “safe” project, like replacing an old machine with a new, identical one, might be discounted at the company’s normal WACC (e.g., 8%).
- A “risky” project, like launching a brand new, untested product in a foreign market, should be discounted at a higher rate (e.g., 8% + a 5% risk premium = 13%).
Using a higher discount rate (the Risk-Adjusted Discount Rate, or RADR) makes future cash flows worth less in today’s dollars. This builds a “margin of safety” into the calculation. It’s a simple way to account for the fact that a risky project’s forecasts are less certain than a safe project’s.
An Introduction to Monte Carlo Simulation
This is the most advanced technique, often used for massive, multi-billion dollar projects.
Instead of just picking three scenarios (best, base, worst), a Monte Carlo simulation uses software to run the analysis 10,000 or 100,000 times.
For each “run,” the computer randomly picks a value for each variable (sales, costs, etc.) based on a probability distribution you define (e.g., “Sales are most likely to be $100,000, but they could be as low as $70,000 or as high as $130,000”).
The result isn’t a single NPV. The result is a probability distribution of the NPV. The final report might look like this:
- “There is a 78% probability this project will have a positive NPV.”
- “There is a 15% probability this project will lose more than $1 million.”
This gives decision-makers an incredibly clear and powerful picture of the project’s complete risk profile.
Common Pitfalls and Real-World Best Practices
The theory of capital budgeting is clean. The real world is messy. Even with the right formulas, it’s incredibly easy to make costly mistakes. These errors aren’t usually in the math; they’re in the assumptions and biases that go into the math.
Here are the most common pitfalls and how to avoid them.
Pitfall 1: The “Shiny Object” Metric (e.g., “The IRR is 50%!”)
The Pitfall: Managers and teams fall in love with a single, impressive-sounding number. A high IRR (50%!) or a fast Payback (1.5 years!) is exciting and easy to pitch. This often leads to selecting “worse” projects. A project with a 50% IRR that only makes $50,000 in value (NPV) is not better than a project with a 15% IRR that makes $5,000,000 in value.
The Best Practice: NPV is king. Always use Net Present Value as your primary decision-making tool. Why? Because it measures the total dollar value added to the company. The goal of a firm is to get richer in absolute dollars, not to have the highest percentage return. Use IRR and Payback as secondary, supporting metrics.
Pitfall 2: Crying Over Spilt Milk (Mismanaging Sunk Costs)
The Pitfall: This is a powerful psychological trap. A “sunk cost” is money that has already been spent and cannot be recovered, no matter what you do. Imagine you spent $2 million developing a new product, and it’s failing. You now have a choice: spend another $1 million to launch it, or scrap it. The trap is thinking, “We can’t stop now! We’ve already spent $2 million!”
The Best Practice: Sunk costs are irrelevant. The $2 million is gone. It is not part of the investment decision. The only question that matters is, “If we spend this new $1 million, what is the NPV of the future cash flows from this point forward?” If the NPV of that future decision is negative, you must scrap the project, even if it means “wasting” the $2 million.
Pitfall 3: Forgetting the “Next Best Thing” (Ignoring Opportunity Costs)
The Pitfall: This is the opposite of a sunk cost. An “opportunity cost” is the value of the best alternative you give up by choosing your project. For example, you decide to build a new factory on a piece of land the company already owns. You might be tempted to list the “cost” of that land as $0 in your analysis. This is wrong.
The Best Practice: Include all opportunity costs. If you didn’t build the factory, what is the next best thing you could do with that land? Could you have sold it for $3 million? Could you have leased it to another company for $200,000 a year? That lost potential income is a relevant cost of your project and must be included (as a cash outflow) in your NPV calculation.
Pitfall 4: The “Hockey Stick” Projection (Over-Optimism Bias)
The Pitfall: You’ve probably seen it: a graph where sales are modest for a year or two, and then suddenly shoot up to the moon, like the blade of a hockey stick. This is over-optimism. The team pitching a project (like the marketing department) is inherently biased. They want their project approved. They will naturally be optimistic about sales and pessimistic about costs.
The Best Practice: Challenge all assumptions. Use the risk analysis tools we discussed. A great best practice is to have a neutral, third-party group (like the central finance department) review and “stress test” the projections. Ask probing questions. “What evidence do we have that sales will triple in Year 3? What if our main competitor matches our price? What if labor costs go up 10%?”
Conclusion
Capital budgeting and investment decisions are the moments that define a company’s future. These are the choices that build empires or lead to ruin.
What we’ve learned is that a successful decision is not a single guess. It is a robust process. It’s a process that separates ideas from strategy, that translates those ideas into the language of cash flow, and that uses rigorous tools to analyze those flows.
It’s a process that respects the time value of money, that prizes value creation (NPV) above all else, and that has the humility to question its own assumptions through risk analysis.
Key Takeaways: Your Capital Budgeting Cheat Sheet
If you remember nothing else from this 5,000-word guide, remember these key points:
- It’s About Long-Term Value: Capital budgeting is the process for evaluating major, long-term investments (CapEx).
- Cash Flow is King: Always use cash flows, not accounting profit. Remember to add back depreciation.
- A Dollar Today is Worth More: The Time Value of Money is non-negotiable. This is why we “discount” future cash flows.
- NPV is the Gold Standard: Net Present Value is the most reliable tool. Positive NPV = Accept. It measures the exact dollar value a project adds to your company.
- IRR is a Percentage: The Internal Rate of Return is a useful measure of a project’s intrinsic return, but it can be misleading when comparing projects. If NPV and IRR conflict, always trust NPV.
- Payback is for Liquidity: The Payback Period only tells you how fast you get your money back. It’s a risk/liquidity measure, not a profitability measure.
- Risk Analysis is Not Optional: Your forecasts are wrong. Use sensitivity, scenario, and risk-adjusted analysis to understand how wrong you can be and still succeed.
- Beware of Biases: Ignore sunk costs, include opportunity costs, and challenge over-optimistic “hockey stick” projections.
The Human Element: Why Judgment Still Matters More Than a Spreadsheet
For all the math, formulas, and spreadsheets, the final decision is—and always should be—human.
A spreadsheet can’t tell you if a project perfectly aligns with the company’s brand. It can’t predict how a competitor will react. It can’t quantify the value of employee morale or the strategic importance of entering a new market.
The models provide the data. They illuminate the financial consequences of your choices. But it is the experience, the strategy, the leadership, and the human judgment of a good manager that ultimately turns that data into a wise decision.
FAQs
What is the most important technique in capital budgeting?
Net Present Value (NPV) is widely considered the most important and reliable technique. Unlike other methods, it provides a direct measure of how much dollar value a project is expected to add to the company, which is the primary goal of any investment.
What is the difference between capital budgeting and working capital management?
Capital budgeting deals with long-term investment decisions in fixed assets, like building a new factory, buying machinery, or launching a 10-year project. Working capital management deals with managing a company’s short-term assets and liabilities (like inventory, accounts receivable, and accounts payable) to ensure smooth day-to-day operations.
How does inflation affect capital budgeting decisions?
Inflation must be handled consistently. The best practice is to use nominal cash flows (which include the effect of inflation) and discount them at a nominal discount rate (which also includes an inflation premium). The mistake is to mix them—for example, using cash flows that don’t account for inflation but discounting them at a nominal rate.
What is a “hurdle rate” in capital budgeting?
A “hurdle rate” is the minimum acceptable rate of return a project must earn to be considered. It’s the “hurdle” that the project’s IRR must clear. For most companies, this rate is their Weighted Average Cost of Capital (WACC), which represents the blended cost of their debt and equity financing.